Clams and Climate

Christine Bassett is currently a graduate student working with Fred Andrus in the Department of Geological Sciences at the University of Alabama and holds a B.A. in Anthropology and a B.S. in Geology from the University of Georgia, US.  This post is based on research for her M.S. in Geology at Alabama.

Sclerochronology and Paleoenvironmental Reconstruction in the North Pacific Ocean

The archaeological record reflects fluctuating marine conditions from the Aleutian Islands to the Northwest coast of North America during the Late Holocene (Wanner et al., 2008). Though not widely tested, recent research suggests that conditions may have cooled enough during the Late Holocene cold phase to allow sea ice to accumulate as far south as the Northern Pacific Ocean. My research is focused on establishing sclerochronological analysis of Saxidomus gigantea as a means of detecting differences in sea surface temperatures in the Northern Pacific Ocean. Sclerochronological and isotopic analysis of skeletal carbonates can provide a proxy for sea surface temperatures as well as the length of seasons during the recent geological record. My research will contribute to a larger project focusing on human and animal adaptation to climate change led by Fred Andrus (Univerisity of Alabama), Catherine West (Boston University), and Mike Etnier (Portland State University) by providing an additional proxy for reconstructing environmental conditions in the Late Holocene.

Figure 1. Cross-section of mature shell, age seven years, magnification 10x.  The arrow denotes the distance between two annual winter growth lines (modified from Hallmann et al., 2009).
Figure 1. Cross-section of mature shell, age seven years, magnification 10x. The arrow denotes the distance between two annual winter growth lines (modified from Hallmann et al., 2009).

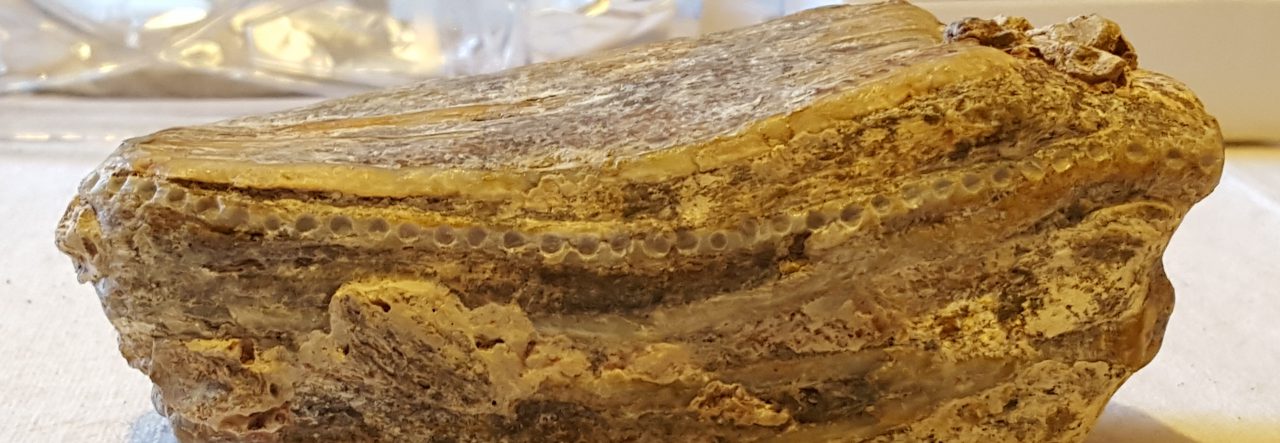
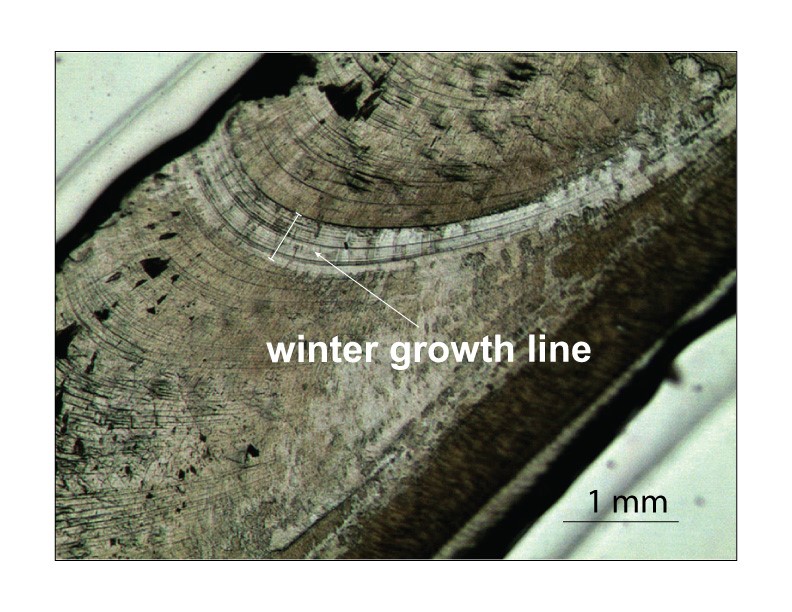
Sclerochronology is the study of the growth of invertebrate skeletons. I work exclusively with bivalves, whose distinct growth lines mark regular biologically and environmentally controlled growth intervals (Hallmann et al., 2009). Isotopic analysis of oxygen (δ18O) from growth lines can identify winter growth bands between successive growing seasons. Nadine Hallman and her colleagues (2009) examined the life history of S. giganteus and compared shell precipitation during the organism’s life with oxygen isotopic analysis. They determined that dark bands (Fig. 1) largely co-occurred with peaks in δ18O (Fig. 2). These dark bands mark the beginning and end of a season of growth and the interval between them represent the length of one growing season.

Oxygen isotope variation
Figure 2. Upper: Shell oxygen isotope record (δ18O, black bars) compared with reconstructed temperature (Tδ18O, light grey curve) and sea surface temperature (SST, dark grey curve) data collected from http://www.cdc.noaa.gov.  Lower:  Daily growth increment width time series (n = number of increments per year.  The blue bars represent the annual winter growth lines measured in (A).  Positive δ18O values correspond with winter growth lines while negative δ18O were sampled from the portion of the shell between winter growth lines.  Oxygen isotope data confirms annual winter growth lines.  Specimen collected September, 9 2007 (modified from Hallmann et al., 2009).

Measuring and comparing the lengths of seasonal shell growth from shells collected at higher latitudes with shells collected from slightly lower latitudes could provide a means of assessing changes in the length of growth seasons, possibly indicating differential sea surfaces temperatures between latitudes. Applying this method to ancient archaeological shells would allow me to test for changes in the length of growing season and by extension, the presence of cold conditions – and possibly sea ice – in the Northern Pacific Ocean during the Late Holocene.

Map of the study area (Alaska)
Figure 3. Collection sites have not yet been determined. Potential site candidates are located along the Gulf of Alaska and include Unalaska (A) and Kodiak Islands (B), Alaska and Dundas Island, B.C. (C) (modified from NASA satellite image).
Winter growth line in S. gigantea
Figure 4. Image of winter growth line in an acetate peel made from S. gigantea cross-section at 40X magnification (Personal image by Bassett, 2014).

To accomplish this, I plan to collect samples of Saxidomus gigantea from Alaska and Northern British Columbia (Fig. 3). I will analyze δ18O profiles across the organism’s second or third year of growth, the most ontogenetically reliable period of growth, to determine that winter growth bands correspond to peaks in δ18O so that later sclerochronological analysis can be performed. For sclerochronological analysis, I will prepare acetate peels (Fig. 4) so that I can then count lunar-daily growth lines between winter growth bands to quantitatively measure the length of the growing season. Assuming I can detect a difference in the length of the growing season between samples collected at different latitudes, I will apply the same method to ancient samples from the same regions. If the method tested here is successful, sclerochronological analysis of bivalves may be able to contribute to δ18O data interpretation and comparative studies with other organisms to provide a more comprehensive view of changes in SST through recent geological history. Understanding climate in the past contributes greatly to archaeological research that seeks to understand how human behavior, particularly the exploitation of floral and faunal resources, changes as components of the environment change.

REFERENCES

Hallmann, N., Burchell, M., Schone, B.R., Irvine, G.V., Maxwell, D., 2009, High-resolution sclerochronological analysis of the bivalve mollusk Saxidomus gigantea from Alaska and British Columbia: techniques for revealing environmental archives and archaeological seasonality. Journal of Archaeological Science, v. 36, pp. 2353-2364.

Wanner, H., Beer, J., Butikofer, J., Crowley, T.J., Cubasch, U., Fluckiger, J., Goosse, H., Grosjean, M., Joos, F., Kaplan, J.O., Kuttel, M., Muller, S.A., Prentice, C., Solomina, O., Stocker, T.F., Tarasov, P., Wagner, M., and Widmann, M., 2008, Mid- to Late Holocene climate change: an overview. Quaternary Science Reviews, v. 27, no. 19-20, pp. 1791-1828.

Climate in Your Dinner

Our latest contributor is Georgia Roberts. Georgia is currently in the second year of her PhD at La Trobe University, Melbourne, Australia, and holds a Masters in Archaeological Science from Australian National University.

Investigations of Seasonality in the Archaeological Record of Southwestern Tasmania, Australia

Stable isotope analysis can support a range of zooarchaeological research. One such application is investigating seasonality – assessing the season of death of individual animals. When these animals are associated with archaeological sites, we can use this data to infer season of site use.

The rugged limestone karst landscape of southwestern Tasmania, Australia, contains several archaeological cave sites with exceptional preservation. This region has been described as an archaeological ‘province’ sharing many characteristics, including distinctive faunal collections, dominated by Bennett’s wallaby (70% by Minimum Number of Individual [MNI] counts) and the Common Wombat (27% MNI). The current project focusses on two of these sites – Warreen Cave and Bone Cave.

Related archaeological sites in southwestern Tasmania. Adapted from Cosgrove et al. 2010.
The wilderness of southwestern Tasmania.

Wombat teeth are continuously growing, capturing the isotopic signature of the surrounding environment in the enamel as it forms. The mandibular incisor is the longest tooth (6-7cm) and records approximately 18 months of isotopic data. By sequentially sampling the enamel, a high-resolution record of local climate (δ18O) and vegetation (δ13C) can be retrieved. By assessing seasonal variation in modern analogues, the data can be used to determine season of death and thus inferred season of site use.

Sequential sampling of tooth enamel along the mandibular incisor from a modern Common wombat.

Dr Anne Pike-Tay and colleagues (Pike-Tay et al. 2008) used odontochronological analysis to identify that Bennett’s wallabies, the primary prey species, had been killed in the same season throughout the chronology of each site – autumn/winter for Warreen Cave and summer for Bone cave. My PhD uses stable isotopic analysis of Common wombat (Vombatus ursinus) teeth to test this trend, investigating when and how wombats were being utilised by Tasmanian Aboriginal people at the end of the Pleistocene (35,000 to 11,500 years ago).

Tasmanian Common Wombats – female with joey.

This research is supported by the La Trobe University Faculty of Humanities and Social Sciences Internal Funding Scheme, the Australian Archaeological Association Research Grant Scheme and Dr Michael Gagan of the Earth Environment Stable Isotope Laboratories (Australian National University).

References

Cosgrove, R., Field, J., Garvey, J., Brenner-Coltrain, J., Goede, A., Charles, B., Wroe, S., Pike-Tay, A., Grün, R., Aubert, M., Lees, W., O’Connell, J., 2010. Overdone overkill – the archaeological perspective on Tasmanian megafaunal extinctions. Journal of Archaeological Science 37, 2486–2503.

Pike-Tay, A., Cosgrove, R., Garvey, J., 2008. Systematic seasonal land use by late Pleistocene Tasmanian Aborigines. Journal of Archaeological Science 35, 2532–2544.